APLpy
APLpy (the Astronomical Plotting Library in Python) is a Python module aimed at producing publication-quality plots of astronomical imaging data in FITS format. It effectively provides a layer on top of Matplotlib to enable plotting of Astronomical images, and allows users to:
- Make plots interactively or using scripts
- Show grayscale, colorscale, and 3-color RGB images of FITS files
- Generate co-aligned FITS cubes to make 3-color RGB images
- Overlay any number of contour sets
- Overlay markers with fully customizable symbols
- Plot customizable shapes like circles, ellipses, and rectangles
- Overlay ds9 region files
- Overlay coordinate grids
- Show colorbars, scalebars, and beams
- Easily customize the appearance of labels and ticks
- Hide, show, and remove different contour and marker layers
- Pan, zoom, and save any view as a full publication-quality plot
- Save plots as EPS, PDF, PS, PNG, and SVG
Documentation
The APLpy Documentation contains all the information needed to run APLpy successfully. The most important page is the Quick Reference Guide which provides concise instructions for all of the APLpy functions. In particular, note that the interface to APLpy is slightly different to Matplotlib, so not all Matplotlib commands will work in APLpy. Be sure to check out the quick reference guide!
When things go wrong
- If you have issues with the installation, either send an email to the python@mpia.de mailing list, or contact the authors directly at astropython@gmail.com.
- If you run into what you believe is a bug, please report it at the GitHub Issue Tracker.
Getting started
Start off by downloading this tar file, expand it, and go to the APLpy-example directory on the command line. Then, launch pylab:
$ ipython --pylab
Import the aplpy module (note the lowercase module name):
import aplpy
And create a new figure to plot the FITS file with:
f = aplpy.FITSFigure('ngc2264_cutout.fits')
This should open up a matplotlib window and will show an empty set of axes with coordinates. From now on, you will interact with the figure by calling methods associated with f. For example, show the image as a grayscale:
f.show_grayscale()
The automatic settings for the stretch should be decent, but there are of course options to allow custom min/max levels. You can now try panning around and zooming in like you would do in Matplotlib, and you will notice the coordinates updating. Press the Home button to reset the view.
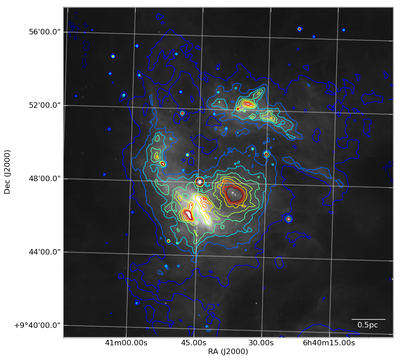
Next, let’s overlay a set of contours from a different image:
f.show_contour('ngc2264_cutout_mips.fits', levels=10)
We can also add a coordinate grid:
f.add_grid()
And finally let’s add a scalebar to make the plot look sciency:
f.add_scalebar(0.03, '0.5pc', color='white')
We can now save our masterpiece either by clicking on the Save icon in the matplotlib window, or doing:
f.save('my_first_plot.eps')
The latter is recommended because it will automatically figure out the best resolution with which to output your plot. Your plot should look something like this:
Exercise 1
Use the help or ? functionality in ipython to figure out how to set the min/max levels on the grayscale manually, and to change the stretch function to a square-root stretch. Also use the Use the Quick Reference Guide to figure out how to change the grayscale to a colorscale.
Click to Show/Hide Solution
To manually set the levels:
f.show_grayscale(vmin=0., vmax=200.)
To additionally use a square-root stretch:
f.show_grayscale(vmin=0.,vmax=200., stretch='sqrt')
To change to a colorscale:
f.show_colorscale()
Note that the colormap can be set using for example:
f.show_colorscale(cmap='gist_heat')
where the value of the cmap argument can be any of the names listed on this page.
Exercise 2
Use the Quick Reference Guide to manually set the tick spacing on both axes. In the default view for the example FITS file above, the arcseconds in the declination are not useful (they are always zero). Try and change the format of the y-axis labels so that they only include degrees and arcminutes.
Click to Show/Hide Solution
To set the tick spacing:
f.ticks.set_xspacing(0.05)
f.ticks.set_yspacing(0.05)
To show the y-axis labels in dd:mm format:
f.tick_labels.set_yformat('dd:mm')
Exercise 3
Use APLpy to plot one of your own FITS images! If you don’t have any FITS files at hand, you can play with this newly-released WISE data of M82!
If you have trouble downloading the file, then start up IPython (ipython -pylab) and enter:
import urllib2, tarfile
url = 'http://python4astronomers.github.com/_downloads/m82_wise.tar'
tarfile.open(fileobj=urllib2.urlopen(url), mode='r|').extractall()
cd m82_wise
ls